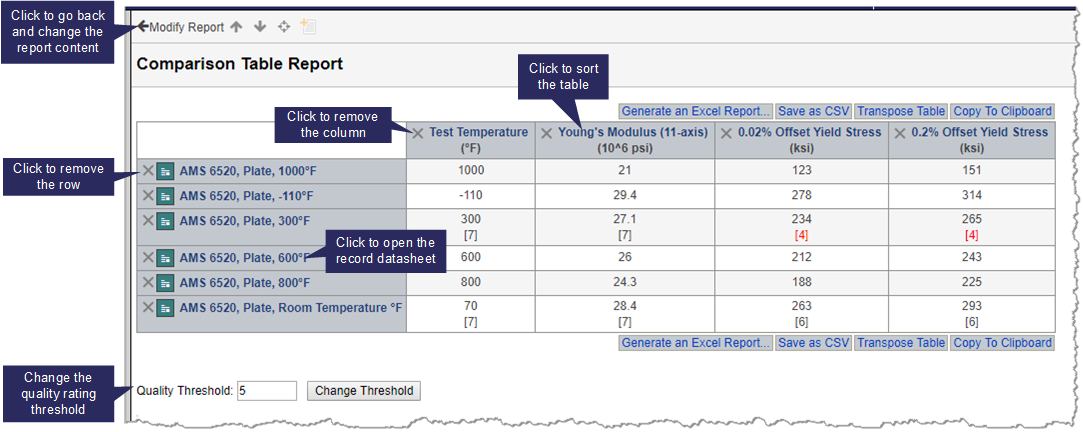
Use a Comparison Table report for a side-by-side comparison of data in selected records; for example:

As well as data values, comparison table reports can include:
For Comparison Tables that include functional data attributes, a graph is shown (when viewing the data on screen only). Click to see an example
You can modify the parameter values by clicking Tools > Change parameters at the top of the page.
Both local and linked tabular data can be included in a Comparison Table. Because linked tabular data is typically too complex to be displayed on screen, you will need to create a Comparison Table Excel report to view it.
 Comparison
Table.
 Attribute
Table Report.
Click Generate an Excel Report to save the Comparison Table in Excel (XLXS) format; see Comparison Table Excel reports.
Click Save as CSV to download the report to a CSV file.
Click Transpose Table to transpose the rows and columns in the on-screen table. Note that this only applies when viewing the report on screen: the default table layout (records=rows, attributes=columns) is used when saving the data to the clipboard, to a CSV file, or as an Excel report.
Click Copy To Clipboard to copy the report data to the clipboard.
In the toolbar at the top of the page:
Saving a Comparison Table as an Excel report allows the full range of Excel analytical and visualization functionality to be used to explore the data. For Comparison Tables that include linked tabular data, this is the only way you can view the data. Click to see an example
Comparison Table Excel Reports are created and managed in the same way as analysis reports: you set up the report in MI:Viewer (select the records of interest, and specify which attributes you are interested in), and then you submit it to a job queue, where the report is created in the background. You can then download the finished report (XLSX) from the Report Monitor tool.
To create a Comparison Table Excel report, click Generate an Excel Report and then click on the Your report was submitted link at the top of the page to open the Report Monitor in a new tab. After logging in to the Report Monitor, you will be able to download your completed report; see the Report Monitor topic for more information about downloading and managing your reports.
Note that the Generate an Excel Report button will be disabled if reporting has not been configured by your MI Application Administrator.
The maximum number of records and attributes that can be included in the report, and the inclusion/exclusion of quality rating data when available are both application options and may be changed in Settings: see Application options: Number of results per page and Database options:Quality System Options.