Editing functional data
Functional attributes (GRANTA MI Float
Functional attribute type) store numerical data as a set of points
that describe how the value varies dependent on one or more parameters.
To edit numeric functional data points, display options, and parameters,
click  Edit this data
near the attribute name on the datasheet. (In a version-controlled table,
this option is only available on unreleased records.) Different options
are available when editing functional data derived from an equation ("Equations
and Logic data"); see Editing equation-based
functional data.
Series functional data and
grid functional data
Functional data points my be stored as a series or grid.
- Series functional data.
Each parameter contains a single value; each set of data corresponds
to an individual series. For example, data points for the functional
attribute Tensile Strength with
Temperature:

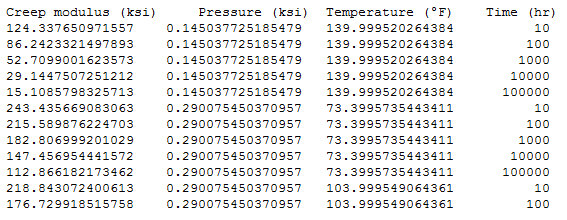
- Grid functional data. More
complex data can be stored as grid functional data, where parameters
may contain a single value or multiple values. For example, data points
for the functional attribute Creep
modulus-time:

To edit functional data
- Ensure that the system is in Edit
Mode.
- Open the datasheet of interest and click
 Edit this data on the left
of the attribute name.
- On the Data Points tab:
- Edit the data points in Microsoft Excel or another spreadsheet
application and paste them into the data field on the
Data Points tab; see Editing data
points below.
- Optionally, select This
graph is estimated to flag the graph data as estimated,
for example, where it was not possible to obtain the data from
authoritative sources.
- Not applicable: Select
this check box if this attribute is not relevant for this record.
Note that selecting Not Applicable
will result in all existing data defined for this attribute being
deleted when you click Save.
- if the data has any associated metadata, you can edit it here.
See Editing text data to find
out about different text formatting options.
- Click on the Display Options
tab to change the appearance of the data graph; see Display
options below.
- Click on the Parameters
tab to specify the interpolation type, scale type and default value
for each of the parameters used to evaluate the data; see Display
options below.
- (Optional) You may be able to add metadata, such as statistical
information or notes about the source of the data.
- (Optional) You can add information about any changes that
you make on the Notes
tab.
- Click Save to save all
your changes.
Editing data points
To edit the data points for numeric functional attributes, on the Data tab, click on Data
Points. Data points should be edited in Microsoft Excel or another
spreadsheet application and pasted into the data field in MI:Viewer. For
series data, individual series are separated by a blank line.
Column headings must be included, and the units should be included
in the headings, where appropriate. For example:

Data value column(s)
For data points with a single value (i.e. not range data), the first
column contains the data value.
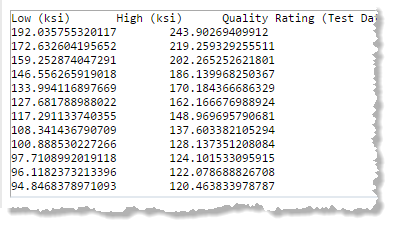
If the data is for a range attribute, the first two columns will contain
the minimum and maximum values, and the column headings must be Low (Units) and High
(Units). Click
to show an example If a low or high value is omitted,
then it assumed that the point's low = high.
Null points may be inserted into gridded data by omitting the value
(or both low and high values for range data). Null points are not allowed
in series data.
Estimated flag or Quality rating column
The column after the data value(s) contains the estimated setting or
data quality rating for each data point. An asterisk * in this column
for a data point indicates that the data point value is estimated.
The column heading is either Estimate
(*) or Quality Rating followed
by the name of the quality rating system in parentheses. For example:
Quality Rating (Test Data Quality system).
Parameter columns
Subsequent columns are parameter values. The column heading must be
the parameter name followed by the units in parentheses, where appropriate;
in the example shown above, the parameter column heading is Temperature
(°F).
The parameter columns may be in any order. Only the parameters for which
there is data need to be present.
Float functional data should be sorted so that the values for the x-axis
parameter are in ascending or descending order. Blank parameter columns
will be ignored.
Line Type column (series data only)
The right-most column contains the line type for series data. The column
heading must be Line Type. Valid
values are for a data point are lines,
markers, or both.
The setting must be the same for a single series (even though a setting
is given for each point), but can vary between series. For example, a
series with parameter Data type = Test Data may be set to Marker,
while a series with Data type = Curve may be set to Lines.
Examples
Data points for a numeric functional attribute Tensile
Strength:

Data points for a range functional attribute Tensile
Strength with Temperature:

Editing display options
To edit the display options for functional attributes, on the Data tab, click on Display
Options.
For series data, you can choose to display the data as a table or a
graph. For graph display, you can then specify the type of scale used
on the graph y-axis (logarithmic or not).
For grid data, you can:
- Choose the x-axis parameter.
- Choose to display the data as a table or a graph. For graph display,
you can then specify:
- the type of scale used on the graph y-axis (logarithmic or
not),
- whether to show lines, markers, or both on the graph.
Editing parameters
To edit the parameters used to evaluate functional attributes, on the
Data tab, click on Parameters.
For each parameter, you can specify the
- Interpolation type (Automatic, None, Cubic Spline, or Linear),
- Scale type (Default, Linear, or Log),
- Default value.
The 'Automatic/Default' setting means that the default setting from
the attribute definition is used. These settings apply to the data for
this attribute in this record only.
 Edit this data
near the attribute name on the datasheet. (In a version-controlled table,
this option is only available on unreleased records.) Different options
are available when editing functional data derived from an equation ("Equations
and Logic data"); see Editing equation-based
functional data.


