Functional data is data whose value varies with some parameter(s). For example, many material properties vary with temperature; the cost of a manufacturing process, per unit, may vary with the total number of units that are made, the material cost, the component mass, and the overhead rate. Functional data may be displayed on a datasheet in various forms. For example:
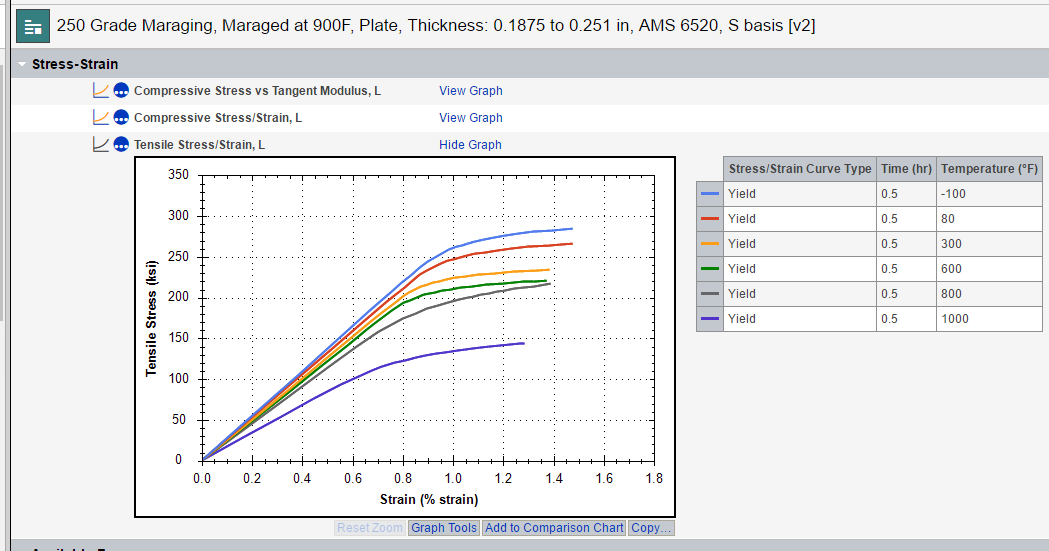
 Viewing functional data graphs
 To view a functional data graph in the datasheet, click View
this data or View Graph.
You can zoom in on sections of the graph and read off values with the mouse. Click to view an example.
Using the commands below the graph, you can:
For data that is based on an equation, you can change the graph title and/or the axis properties by clicking Graph Tools. For other types of functional data, Graph Tools opens a page where you can look at the underlying graph data in more detail.
Click View>Show high-res graph to view the graph in a new browser tab/window, allowing you to view it in higher resolution, and to print the graph, parameter settings and metadata.
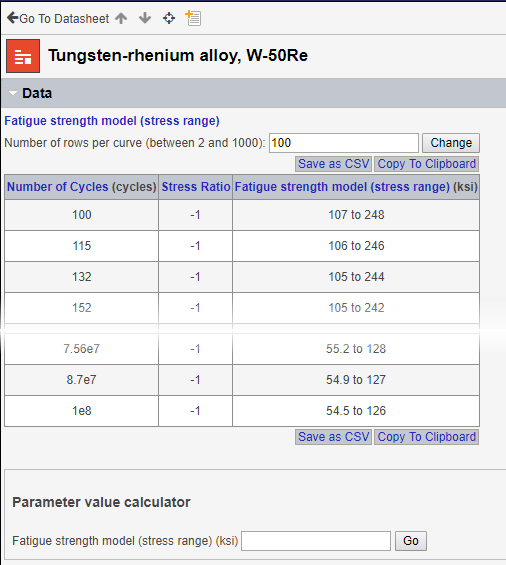
 Viewing functional data tables
To view a functional data table in the datasheet, click View
this data or View Table.
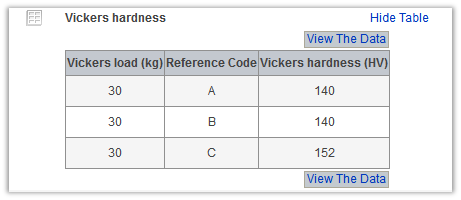
Quality ratings for each data point will be shown in a column, if available. Click View The Data to display the table in its own view, where you can:
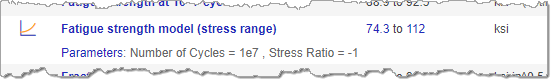
For some types of data, you can also interpolate a y-axis value from a specified parameter value in this data view.
For data values based on an equation, you can explore the effect of changing the parameter values used to calculate the equation and adding curves to the graph; note that this does not change any data in the database, just the display in the current session. You can also view a table of the data points, and change the graph axes.
Click Save.
Click View The Data below the graph to view a table of the data points calculated at a specified number of points along the curve. Click to show an example
On this page you can:
The order of parameters associated with functional data is important in some cases. Specifically, if you are using grid functional data where one or more of the parameters use cubic spline interpolation, then parameter order may have an effect on the interpolation results. Note that parameter order has no effect if only linear interpolation is being used, or in series functional data.
Parameter order is important because gridded graphs are interpolated one parameter at a time. So, for a graph with 3 parameters (strain, cycles and time), to interpolate to a single point:
If we use a non-linear interpolation strategy for one of those steps, the value of the interpolated point can vary depending upon the order in which we interpolate the parameters.
Note that each piece of functional data can have the parameters stored in a different order. If version control is being used, then each version of the data can have a different order.
The order of parameters on functional data is set when you view the data in MI:Viewer, or when data is imported by the Excel or Text importer. In MI:Viewer, the order of the parameters is controlled by the order of the parameter columns. Grid functional data has the following format:
| Column | Contains |
|---|---|
| 1 | Value (low) |
| 2 | Value (high) |
| 3 | Quality rating |
| 4 | Parameter 1 |
| 5 | Parameter 2 |
| 6 | Parameter 3 |
| … | Parameter n |
In this example, Parameter 1 will be first, followed by Parameter 2, etc.
It is possible to check the order of parameters by using the View All Data option in Graph Tools. The order that the parameters appear in the columns is the order they are stored in the functional data.